Coldwater lake
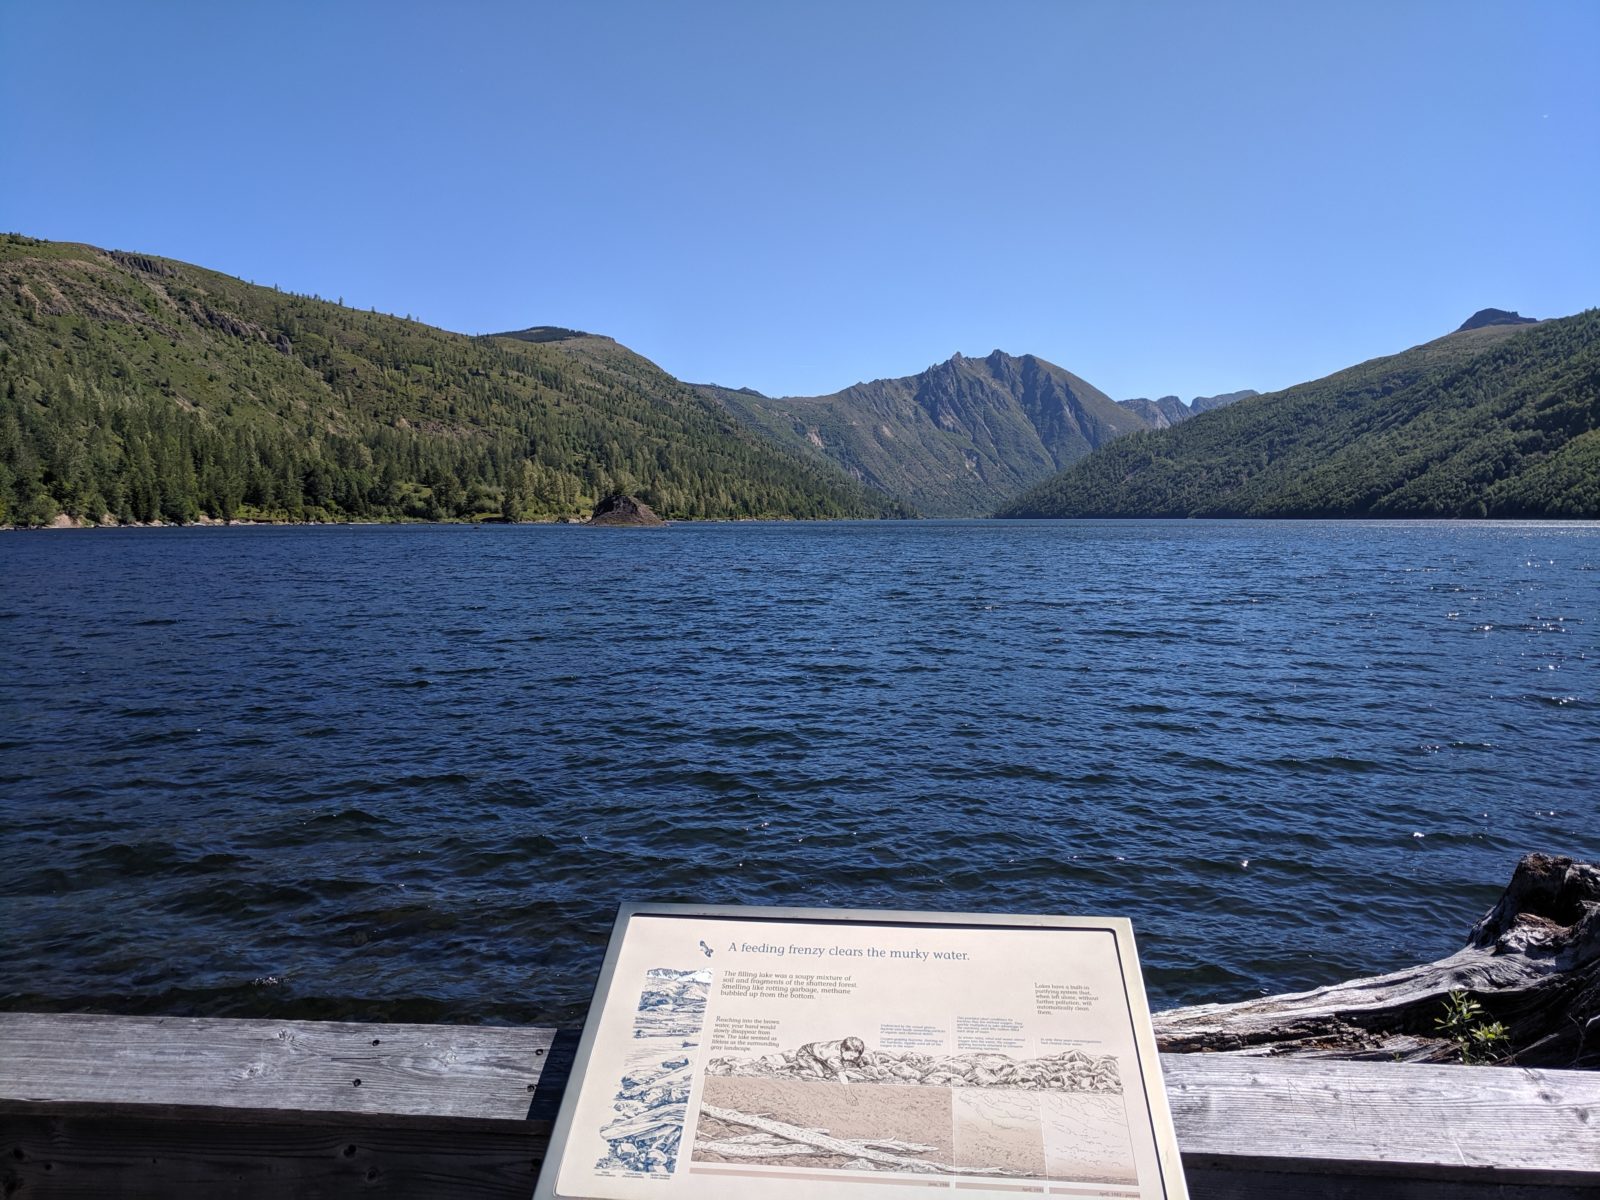
Installed on pier on the "Birth of a Lake Trail" that begins at the picnic area.
Loading map...
Gauge Data
2025-03-22
Height in feet:
1.13 feet
| Height in feet | Date | Notes |
|---|---|---|
| 1.130 | 2025-03-22 | |
| 1.800 | 2025-03-01 | |
| 1.590 | 2025-03-01 | |
| 0.820 | 2025-01-30 | |
| 0.960 | 2025-01-23 | |
| 1.320 | 2025-01-09 | |
| 1.450 | 2025-01-06 | |
| 1.200 | 2024-12-13 | |
| 1.260 | 2024-12-09 | |
| 1.250 | 2024-11-13 | |
| 0.900 | 2024-11-10 | |
| 0.900 | 2024-11-09 | |
| 0.500 | 2024-10-19 | |
| 0.400 | 2024-10-11 | |
| 0.450 | 2024-10-08 | |
| 0.450 | 2024-10-07 | |
| 0.400 | 2024-09-07 | |
| 0.482 | 2024-08-31 | |
| 0.450 | 2024-08-29 | |
| 0.450 | 2024-08-18 | |
| 0.480 | 2024-08-15 | |
| 0.500 | 2024-08-13 | |
| 0.600 | 2024-08-04 | |
| 0.600 | 2024-08-04 | |
| 0.650 | 2024-08-01 | |
| 0.600 | 2024-08-01 | |
| 0.600 | 2024-07-31 | Tracie Davis Portland Parks & Rec Lead & Driver Lifelong Rec Program |
| 0.600 | 2024-07-25 | |
| 0.800 | 2024-07-23 | |
| 1.000 | 2024-07-05 | |
| 1.000 | 2024-07-03 | |
| 1.100 | 2024-06-29 | |
| 1.180 | 2024-06-22 | |
| 1.520 | 2024-06-12 | |
| 1.800 | 2024-06-08 | |
| 1.850 | 2024-06-07 | |
| 1.900 | 2024-06-06 | |
| 1.400 | 2024-06-02 | |
| 1.400 | 2024-06-01 | |
| 1.420 | 2024-05-31 | |
| 1.600 | 2024-05-27 | |
| 1.520 | 2024-05-25 | |
| 1.570 | 2024-05-19 | feet |
| 1.570 | 2024-05-19 | 0.48 METERS |
| 1.770 | 2024-05-12 | |
| 1.700 | 2024-05-09 | |
| 1.710 | 2024-05-07 | |
| 1.140 | 2024-04-22 | |
| 1.200 | 2024-04-11 | |
| 1.200 | 2024-04-11 | |
| 1.300 | 2024-04-01 | |
| 1.400 | 2024-03-30 | |
| 1.480 | 2024-03-24 | |
| 1.160 | 2024-03-17 | |
| 1.160 | 2024-03-17 | Regarding the December 7th measurement, I took that, and have the photo to verify the level. Castle lake is a much smaller catch basin and responds faster to changes. |
| 1.100 | 2024-03-16 | |
| 1.500 | 2024-02-26 | |
| 2.960 | 2023-12-08 | |
| 3.260 | 2023-12-07 | |
| 3.180 | 2023-12-06 | This reading is near the time of the maximum lake level recorded at nearby Castle Lake (see USGS gage 14240446), and from inspection of wash lines along the banks of inflowing SF Coldwater Creek and outflowing Coldwater Creek, appears to have been after peak streamflow. So, it is interesting to note that the reading on Dec. 7 is higher. Perhaps this reflects continued increasing outflow from the Spirit Lake drain tunnel? Spirit Lake peaks are significantly delayed compared to unregulated Castle Lake, so probably affects timing of Coldwater Lake peaks. (It's also conceivable the 12-7 reading was in error, or that some debris lodged on the exit channel control.) |
| 1.150 | 2023-11-25 | |
| 1.230 | 2023-11-20 | |
| 1.260 | 2023-11-20 | |
| 1.660 | 2023-11-10 | |
| 1.200 | 2023-11-04 | |
| 0.700 | 2023-10-28 | |
| 0.780 | 2023-10-22 | |
| 0.900 | 2023-10-13 | |
| 0.690 | 2023-10-08 | |
| 0.680 | 2023-10-02 | |
| 0.680 | 2023-10-02 | |
| 0.690 | 2023-09-29 | Calm waters, just below 0.7 mark. Ruler fastened to pier, can't move. |
| 0.440 | 2023-09-22 | |
| 0.430 | 2023-09-20 | |
| 0.460 | 2023-09-08 | |
| 0.460 | 2023-09-07 | |
| 0.520 | 2023-09-03 | |
| 0.450 | 2023-08-27 | |
| 1.160 | 2023-08-05 | |
| 0.650 | 2023-07-21 | |
| 0.680 | 2023-07-18 | |
| 0.700 | 2023-07-17 | |
| 0.800 | 2023-07-12 | |
| 0.800 | 2023-07-12 | |
| 0.920 | 2023-07-07 | at 1:19pm |
| 1.000 | 2023-07-05 | foot |
| 1.040 | 2023-07-03 | 03 July 2023 at 15:20 |
| 1.140 | 2023-06-27 | (@ 6pm) |
| 1.160 | 2023-06-25 | |
| 1.200 | 2023-06-23 | |
| 1.280 | 2023-06-21 | |
| 1.350 | 2023-06-19 | |
| 1.400 | 2023-06-18 | 4.30pm |
| 1.440 | 2023-06-16 | |
| 2.980 | 2023-05-16 | Lots of snowmelt, as well as landslide debris making it to the lake. It’s very high right now. I’d call it close to bankfull. |
| 2.500 | 2023-05-14 | |
| 2.160 | 2023-05-10 | |
| 2.180 | 2023-05-09 | |
| 2.200 | 2023-05-08 | |
| 2.260 | 2023-05-03 | |
| 2.280 | 2023-05-02 | |
| 1.750 | 2023-04-27 | |
| 1.580 | 2023-04-25 | |
| 1.550 | 2023-04-15 | |
| 1.560 | 2023-04-15 | |
| 1.100 | 2023-04-06 | |
| 1.000 | 2023-03-21 | |
| 0.950 | 2023-03-18 | ft |
| 1.140 | 2023-01-30 | |
| 1.600 | 2023-01-15 | |
| 1.020 | 2022-11-13 | |
| 0.540 | 2022-10-27 | |
| 0.290 | 2022-10-19 | |
| 0.300 | 2022-10-18 | |
| 0.300 | 2022-10-17 | meters 2:23pm |
| 0.360 | 2022-10-08 | |
| 0.350 | 2022-10-06 | |
| 0.350 | 2022-09-29 | |
| 0.360 | 2022-09-27 | |
| 0.360 | 2022-09-17 | Project Staff Note: This measurement was originally submitted as 0.036, but given the meaurements immediately before and after, project staff changed it to 0.36 |
| 0.360 | 2022-09-14 | project staff cleaned the gauge and replace the sign. 11:00 a.m. local time |
| 0.360 | 2022-09-14 | Project staff cleaned the gauge and replaced the sign |
| 0.420 | 2022-09-03 | |
| 0.475 | 2022-08-29 | |
| 0.480 | 2022-08-27 | @ 2:30pm 08/27/2022 |
| 0.520 | 2022-08-21 | |
| 0.560 | 2022-08-18 | |
| 0.680 | 2022-08-07 | |
| 0.690 | 2022-08-05 | |
| 0.800 | 2022-07-30 | |
| 1.200 | 2022-07-11 | |
| 1.350 | 2022-07-07 | |
| 1.400 | 2022-07-05 | |
| 1.900 | 2022-06-22 | |
| 2.320 | 2022-06-10 | |
| 2.360 | 2022-06-10 | |
| 2.140 | 2022-06-04 | |
| 2.210 | 2022-05-29 | |
| 2.100 | 2022-05-27 | |
| 1.860 | 2022-05-24 | |
| 2.050 | 2022-05-16 | |
| 1.720 | 2022-05-14 | |
| 2.200 | 2022-05-08 | |
| 1.550 | 2022-05-02 | |
| 1.440 | 2022-03-23 | |
| 1.450 | 2022-03-16 | |
| 1.600 | 2021-11-27 | |
| 1.600 | 2021-11-25 | |
| 1.600 | 2021-11-06 | |
| 1.450 | 2021-10-27 | |
| 1.200 | 2021-10-25 | |
| 0.750 | 2021-10-15 | |
| 0.700 | 2021-10-08 | |
| 0.740 | 2021-10-02 | |
| 0.740 | 2021-10-01 | |
| 0.650 | 2021-09-27 | |
| 0.700 | 2021-09-22 | |
| 0.480 | 2021-09-12 | |
| 0.480 | 2021-09-12 | |
| 0.490 | 2021-09-03 | |
| 0.490 | 2021-09-03 | |
| 0.540 | 2021-08-29 | |
| 0.520 | 2021-08-29 | |
| 0.520 | 2021-08-27 | |
| 0.550 | 2021-08-18 | |
| 0.550 | 2021-08-18 | |
| 0.600 | 2021-08-12 | on 8/11/21 at 15:30 |
| 0.640 | 2021-08-10 | |
| 0.650 | 2021-08-07 | |
| 0.700 | 2021-08-06 | |
| 0.650 | 2021-08-06 | |
| 0.700 | 2021-07-31 | |
| 0.700 | 2021-07-29 | |
| 0.700 | 2021-07-29 | |
| 0.900 | 2021-07-16 | |
| 0.900 | 2021-07-16 | |
| 1.180 | 2021-07-08 | |
| 1.300 | 2021-07-05 | |
| 1.300 | 2021-07-05 | |
| 1.540 | 2021-07-01 | |
| 1.580 | 2021-06-30 | |
| 1.700 | 2021-06-27 | |
| 1.750 | 2021-06-20 | |
| 1.800 | 2021-06-17 | |
| 1.580 | 2021-06-12 | |
| 1.700 | 2021-06-09 | |
| 1.900 | 2021-06-07 | project staff clean the gauge |
| 2.140 | 2021-06-03 | |
| 1.900 | 2021-05-31 | |
| 1.920 | 2021-05-31 | |
| 1.900 | 2021-05-30 | |
| 1.800 | 2021-05-26 | |
| 1.750 | 2021-05-26 | |
| 1.700 | 2021-05-22 | |
| 2.040 | 2021-05-18 | |
| 1.960 | 2021-05-16 | |
| 1.760 | 2021-05-12 | |
| 1.800 | 2021-05-10 | |
| 1.680 | 2021-04-27 | |
| 1.800 | 2021-04-22 | Staff plate looks good. No rain and warm weather make the rise from 4/15 entirely due to snowmelt. Similar rises at nearby monitored Spirt Lake and Castle Lake show the same snowmelt rise. |
| 1.460 | 2021-04-18 | |
| 1.200 | 2021-04-15 | |
| 1.200 | 2021-04-15 | |
| 1.200 | 2021-04-15 | |
| 1.250 | 2021-04-09 | |
| 1.300 | 2021-04-08 | |
| 1.300 | 2021-04-08 | |
| 1.240 | 2021-04-06 | |
| 1.240 | 2021-04-05 | |
| 1.290 | 2021-03-11 | |
| 1.480 | 2021-02-07 | |
| 1.700 | 2021-01-21 | |
| 1.700 | 2021-01-21 | |
| 1.940 | 2021-01-19 | |
| 2.440 | 2021-01-16 | |
| 1.500 | 2020-12-29 | feet |
| 1.100 | 2020-12-06 | |
| 1.100 | 2020-10-19 | |
| 1.100 | 2020-10-18 | |
| 1.180 | 2020-10-16 | |
| 0.800 | 2020-10-11 | |
| 0.700 | 2020-10-10 | |
| 0.500 | 2020-09-02 | 2020-090-02 13:30 |
| 0.580 | 2020-08-29 | |
| 0.550 | 2020-08-27 | |
| 0.600 | 2020-08-23 | |
| 0.620 | 2020-08-22 | |
| 0.700 | 2020-08-13 | |
| 0.700 | 2020-08-10 | |
| 0.700 | 2020-08-09 | |
| 0.700 | 2020-08-08 | |
| 0.750 | 2020-08-05 | |
| 0.800 | 2020-08-02 | |
| 0.800 | 2020-08-02 | |
| 0.900 | 2020-07-30 | |
| 0.900 | 2020-07-25 | |
| 1.030 | 2020-07-19 | |
| 1.080 | 2020-07-17 | |
| 1.100 | 2020-07-14 | |
| 1.100 | 2020-07-12 | |
| 1.070 | 2020-07-10 | |
| 1.100 | 2020-07-09 | |
| 1.100 | 2020-07-07 | |
| 1.180 | 2020-07-05 | |
| 1.300 | 2020-07-03 | |
| 1.280 | 2020-07-03 | |
| 1.800 | 2020-06-16 | |
| 1.700 | 2020-06-12 | |
| 1.960 | 2020-06-01 | |
| 1.880 | 2020-05-25 | |
| 1.800 | 2020-05-24 | at 12:09 PDT 2020-05-25, but you might get this later when I have reception |
| 1.800 | 2020-05-24 | |
| 1.800 | 2020-05-24 | |
| 1.900 | 2020-05-22 | |
| 1.850 | 2020-05-18 | |
| 1.860 | 2020-05-17 | |
| 1.850 | 2020-05-16 | |
| 1.160 | 2020-03-23 | |
| 1.160 | 2020-03-18 | |
| 1.450 | 2020-03-08 | |
| 1.450 | 2020-03-06 | |
| 1.380 | 2020-02-29 | February 28 2020. |
| 2.180 | 2020-02-14 | |
| 2.460 | 2020-02-01 | small waves |
| 2.400 | 2020-01-25 | |
| 1.280 | 2019-12-20 | there is snow on the ground and a very thin layer of ice on the edges of the gauge |
| 1.000 | 2019-12-18 | level ok no waves Houston clear |
| 1.270 | 2019-11-23 | |
| 1.000 | 2019-11-21 | small waves |
| 0.900 | 2019-11-17 | |
| 0.900 | 2019-11-09 | |
| 1.080 | 2019-11-04 | |
| 1.400 | 2019-10-29 | project staff take elevation measurement and clean gauge |
| 1.400 | 2019-10-29 | project staff second measurement while taking elevation |
| 1.580 | 2019-10-27 | |
| 1.900 | 2019-10-23 | small waves |
| 1.820 | 2019-10-22 | |
| 1.120 | 2019-10-09 | |
| 1.100 | 2019-10-08 | (submitted on to/10) Small waves level ok 10/8/19 |
| 0.950 | 2019-09-26 | |
| 1.430 | 2019-09-20 | |
| 0.790 | 2019-09-14 | |
| 0.860 | 2019-09-13 | |
| 0.740 | 2019-09-07 | at 13:39 on 9/7/19 Originally submitted on 9/8 but project staff moved it based on the above note |
| 0.870 | 2019-09-06 | |
| 0.860 | 2019-09-02 | |
| 0.850 | 2019-09-01 | |
| 0.900 | 2019-08-28 | |
| 0.900 | 2019-08-27 | |
| 0.940 | 2019-08-24 | |
| 0.900 | 2019-08-24 | |
| 0.900 | 2019-08-22 | small waves level ok 8/22 |
| 0.850 | 2019-08-19 | Measurement based on submitted photo |
| 0.790 | 2019-08-17 | |
| 0.640 | 2019-08-15 | |
| 0.500 | 2019-08-12 | |
| 0.500 | 2019-08-11 | |
| 0.400 | 2019-08-08 | |
| 0.440 | 2019-08-07 | |
| 0.430 | 2019-08-07 | |
| 0.440 | 2019-08-05 | Measurement based on submitted photo |
| 0.490 | 2019-08-03 | level ok no waves |
| 0.480 | 2019-08-02 | |
| 0.570 | 2019-08-02 | |
| 0.550 | 2019-08-01 | |
| 0.560 | 2019-07-26 | |
| 0.640 | 2019-07-20 | level ok no waves |
| 0.630 | 2019-07-19 | |
| 0.650 | 2019-07-16 | |
| 0.700 | 2019-07-10 | |
| 0.700 | 2019-07-07 | |
| 0.740 | 2019-07-06 | |
| 0.760 | 2019-07-05 | level ok no waves |
| 0.780 | 2019-07-05 | |
| 0.850 | 2019-06-30 | |
| 0.900 | 2019-06-27 | level ok no waves |
| 0.880 | 2019-06-24 | |
| 0.940 | 2019-06-23 | |
| 1.000 | 2019-06-19 | |
| 1.080 | 2019-06-17 | at 4:20pm |
| 1.000 | 2019-06-17 | Measurement based on submitted photo |
| 1.260 | 2019-06-15 | level ok no waves |
| 1.170 | 2019-06-15 | |
| 1.270 | 2019-06-11 | waves from 1.22 to 1.32. project staff installed gauge at 10:15 am pdt on Tuesday 6/11/19 |
| 1.280 | 2019-06-11 | project staff installed gauge |
Gallery